The Jaggle Effect
Gluteal soft tissue after a heel strike behaves like a lightly damped mass–spring–damper. This page models it, applies Shannon information theory to the resulting signal, and lets you change the assumptions yourself. All parameters are assumptions pending measurement; this is an educational model, not a clinical conclusion.
Download full paper (PDF)Plain-text companionInteractive model
Move the sliders: the page recomputes fn and ζ from the paper’s scaling laws and simulates a running heel-strike train (half-sine pulses, 0.06 s, 2.5 g).
Dashed lines in the plot mark ±peak. The interactive uses a jitter-free periodic train, so peaks are about 12 % below the stochastic values in the tables.
1 · The model
Let z(t) be tissue displacement relative to the pelvis and ab(t) the pelvis vertical acceleration:
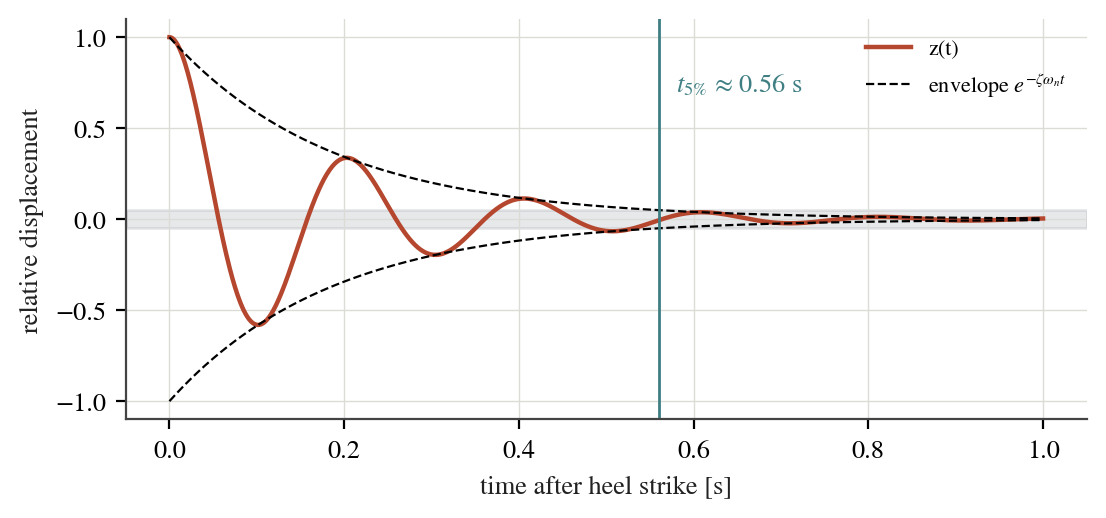
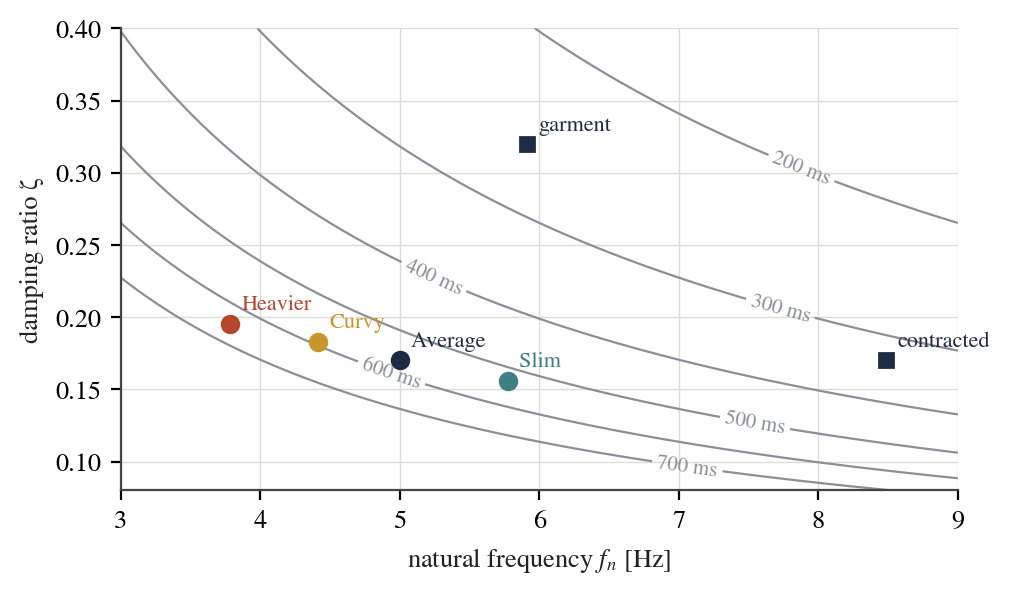
For ζ < 1 the tissue swings at ωd = ωn√(1−ζ²) and decays; that swinging is the jiggle. The decay is described by the logarithmic decrement and the 5 % settling time:
Dependence on body size, composition and shape
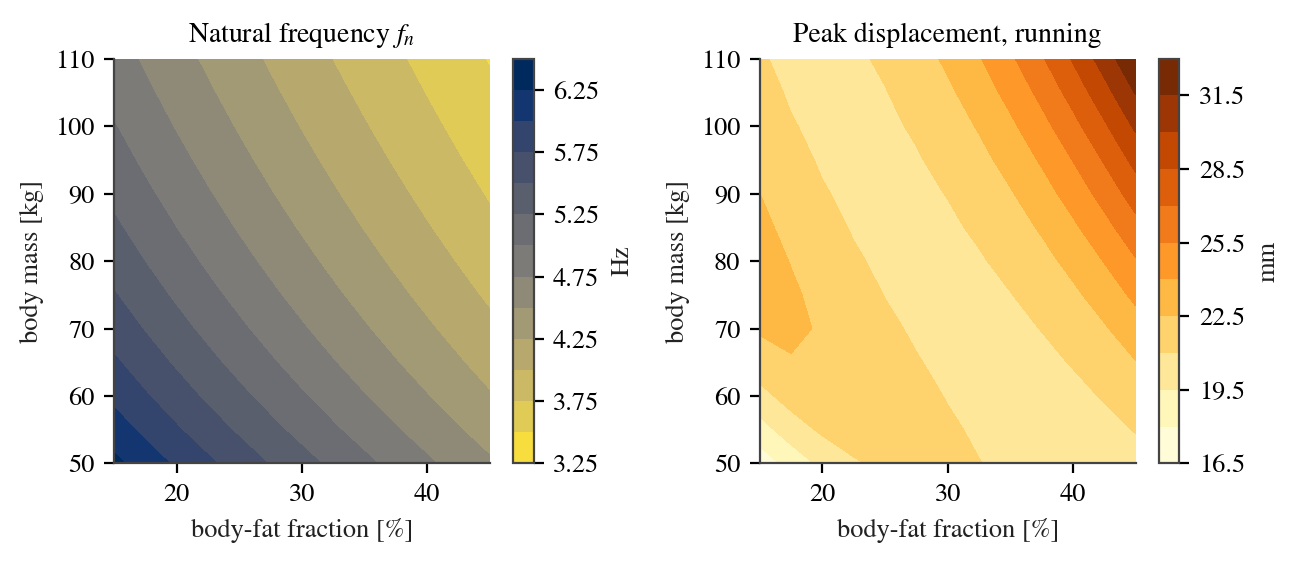
fₙ = (1/2π)·√(σ C₀ E_eff / m_eff^(2/3)) ∝ m_eff^(−1/3) , ζ = (1−BF)·0.12 + BF·0.30
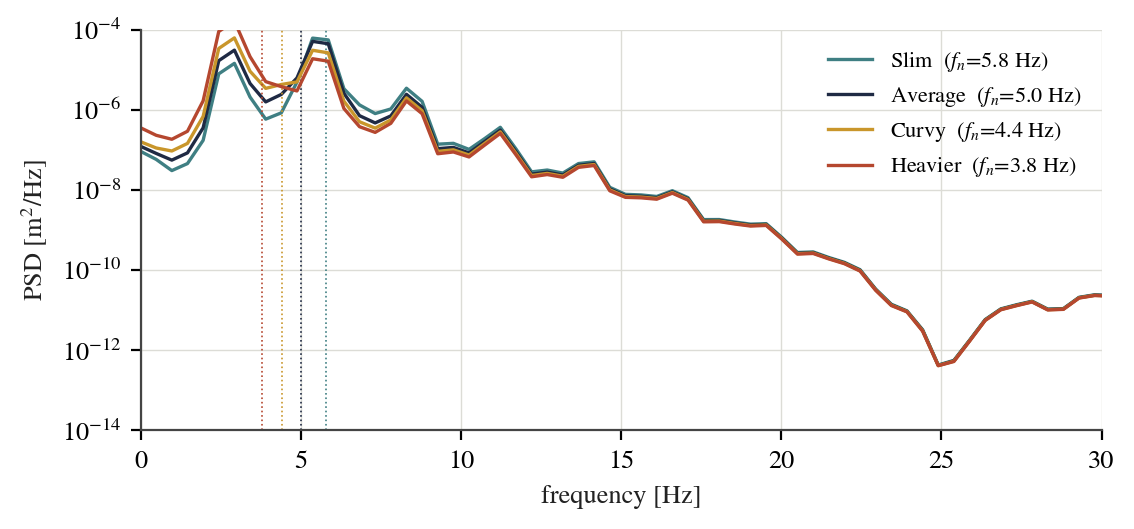
Heavier tissue lowers fn (slower, larger jiggle), stiffer tissue raises it, and a wider, flatter shape (larger σ) raises it too. Calibration: the average relaxed body (65 kg, 28 % fat) has fn = 5 Hz; muscle contraction multiplies Em by 3, a garment multiplies k by 1.4 and sets ζ = 0.32.
Frequency response
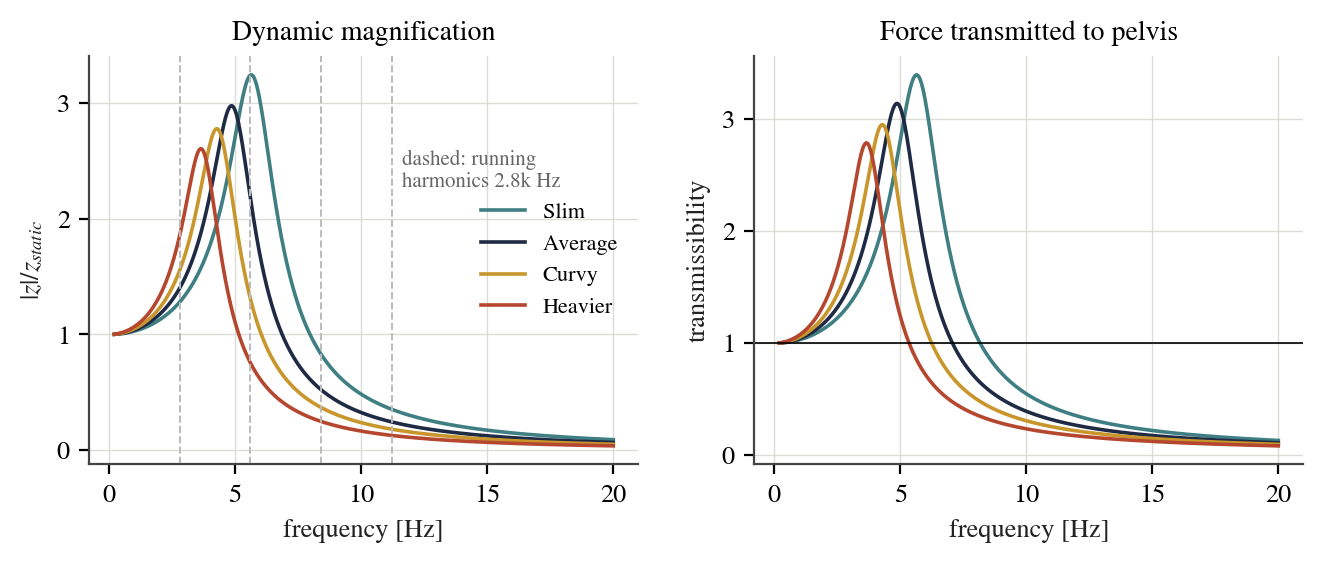
f_r = fₙ√(1−2ζ²) , Q ≈ 1/(2ζ) , Δf₋₃dB ≈ 2ζ fₙ , T(r) = √((1+(2ζr)²)/((1−r²)²+(2ζr)²))
| Body | fr Hz | Q | Δf Hz | δ | energy lost / cycle |
|---|---|---|---|---|---|
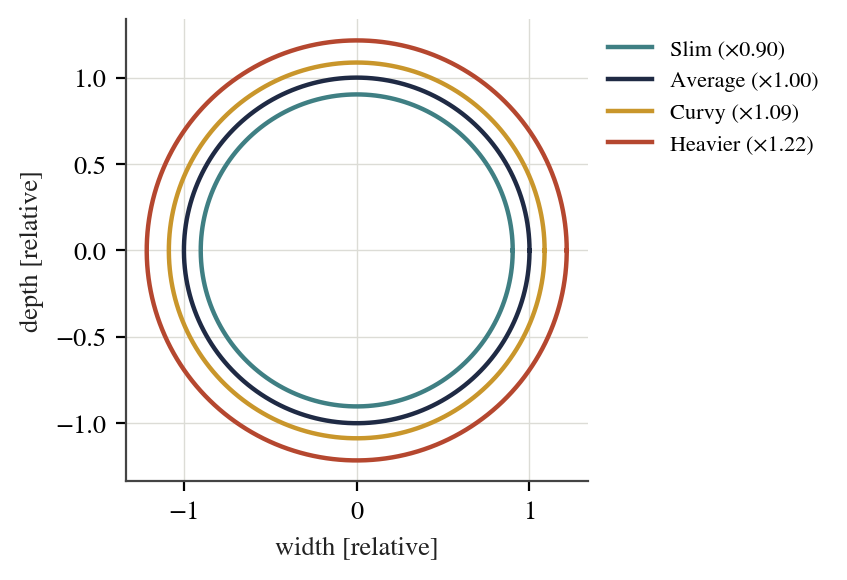
| Slim | 5.63 | 3.2 | 1.80 | 0.99 | 86 % |
| Average | 4.85 | 3.0 | 1.70 | 1.09 | 89 % |
| Curvy | 4.27 | 2.8 | 1.62 | 1.17 | 90 % |
| Heavier | 3.64 | 2.6 | 1.48 | 1.25 | 92 % |
Per cycle the vibration energy falls by e−2δ, so the average body dissipates about 89 % of it every swing, which is why soft tissue matters for impact attenuation.
2 · Shannon information theory
Hₛ = −(1/log₂N) Σ P̂ₖ log₂ P̂ₖ ∈ [0,1] (spectral entropy, Welch PSD)
fₛ ≥ 2f_max (Nyquist) , C = B·log₂(1 + S/N) (Shannon–Hartley)
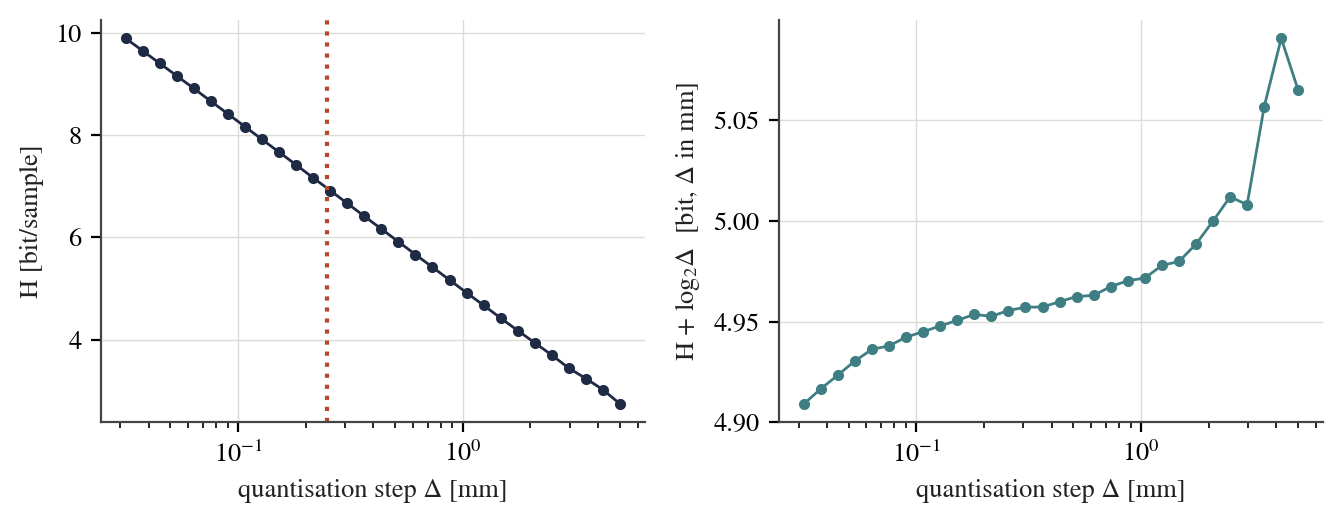
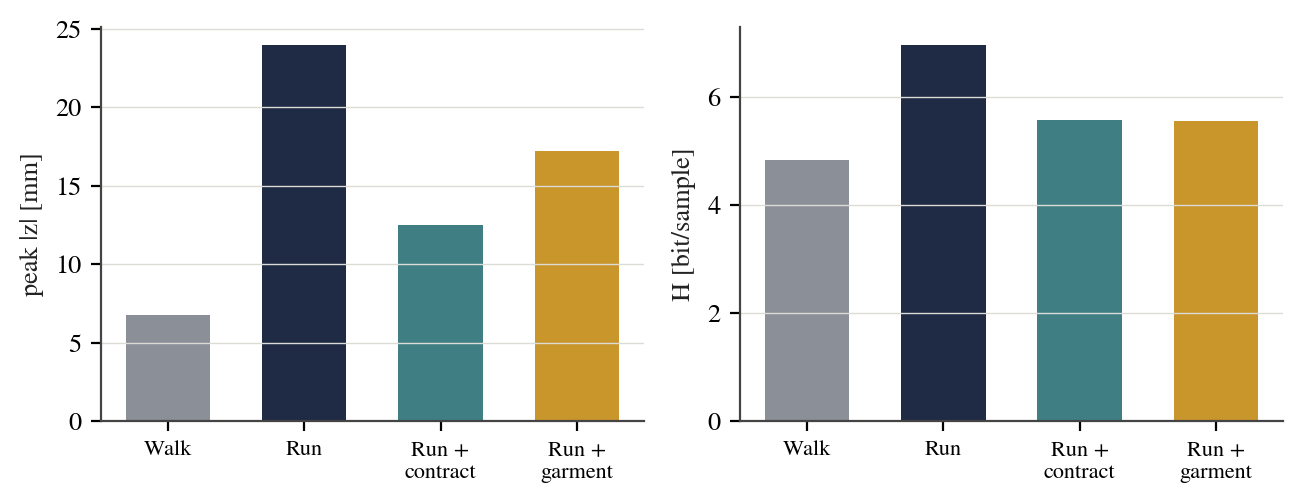
Entropy depends on the sensor. For small Δ, H ≈ h(Z) − log₂Δ: halving the step adds one bit. On the simulated signal H + log₂Δ stays flat at about 4.9 bit (Δ in mm) until Δ becomes coarse.
Spectral entropy separates character from size: it is lowest for the heaviest body (0.32, energy concentrated at one resonance) and highest for the stiffened tissue (0.51).
3 · Results
Body size and composition (running, relaxed, σ = 1)
| Type | M kg | BF % | meff kg | fn Hz | ζ | Peak mm | RMS mm | t5% ms | H bit | Hs |
|---|---|---|---|---|---|---|---|---|---|---|
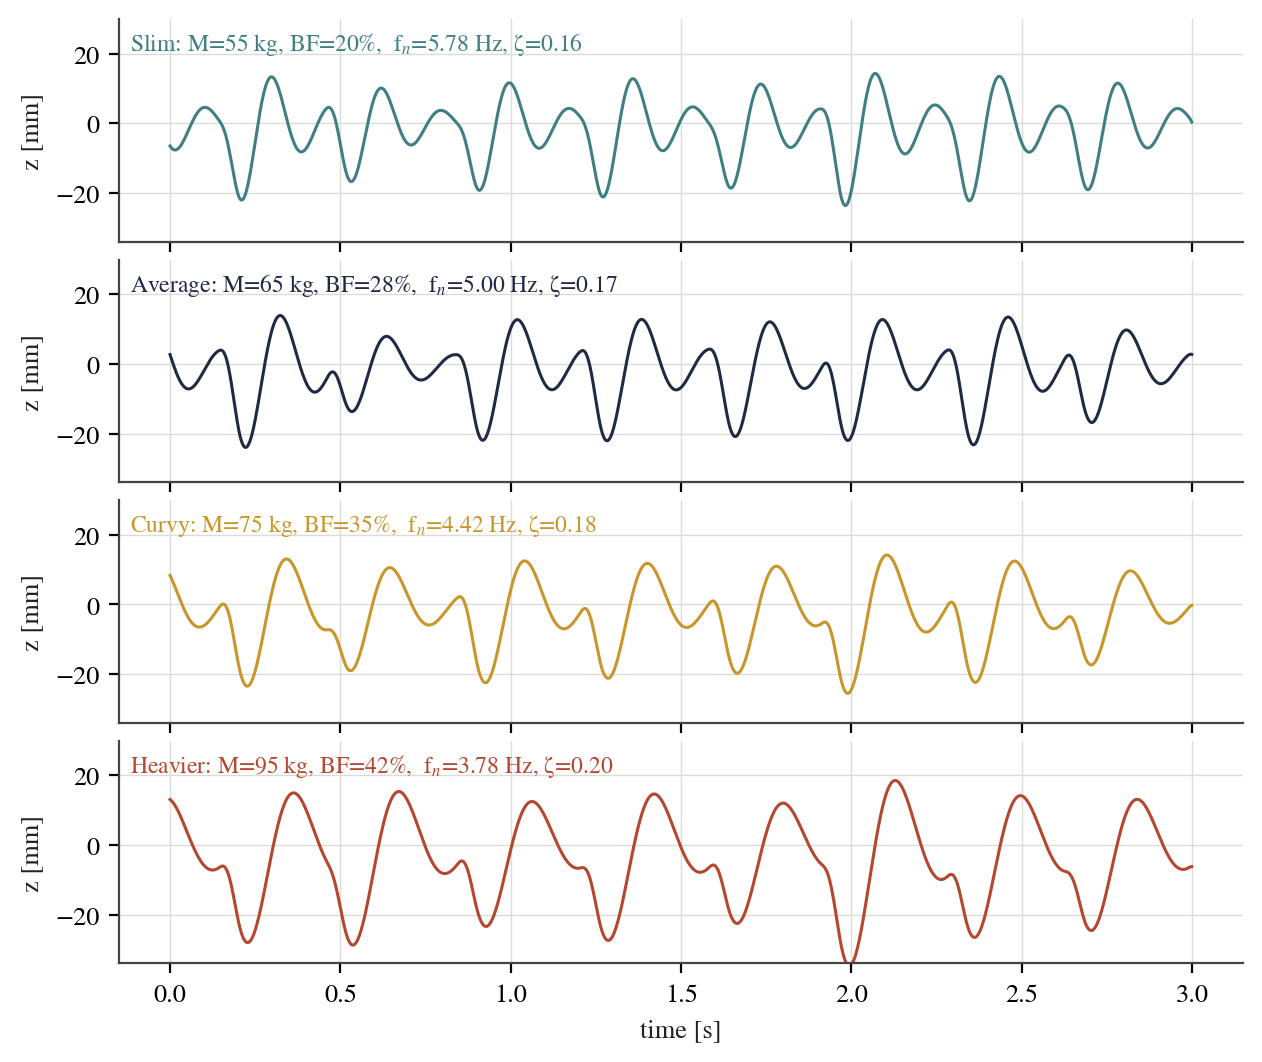
| Slim | 55 | 20 | 1.76 | 5.78 | 0.16 | 23.6 | 8.7 | 529 | 6.87 | 0.37 |
| Average | 65 | 28 | 2.39 | 5.00 | 0.17 | 24.0 | 8.9 | 560 | 6.96 | 0.41 |
| Curvy | 75 | 35 | 3.07 | 4.42 | 0.18 | 25.5 | 9.3 | 590 | 6.95 | 0.41 |
| Heavier | 95 | 42 | 4.29 | 3.78 | 0.20 | 34.7 | 12.6 | 645 | 7.37 | 0.32 |
Activity, muscle contraction and compression garment (65 kg, 28 % BF)
| Condition | fn Hz | ζ | Peak mm | RMS mm | t5% ms | H bit | Hs |
|---|---|---|---|---|---|---|---|
| Walking, relaxed | 5.00 | 0.17 | 6.8 | 2.2 | 560 | 4.83 | 0.47 |
| Running, relaxed | 5.00 | 0.17 | 24.0 | 8.9 | 560 | 6.96 | 0.41 |
| Running, muscle contracted | 8.49 | 0.17 | 12.5 | 3.8 | 330 | 5.57 | 0.51 |
| Running, compression garment | 5.91 | 0.32 | 17.2 | 5.1 | 252 | 5.56 | 0.45 |
Tissue shape
| Shape | σ | fn Hz | Peak mm | RMS mm | H bit | Hs |
|---|---|---|---|---|---|---|
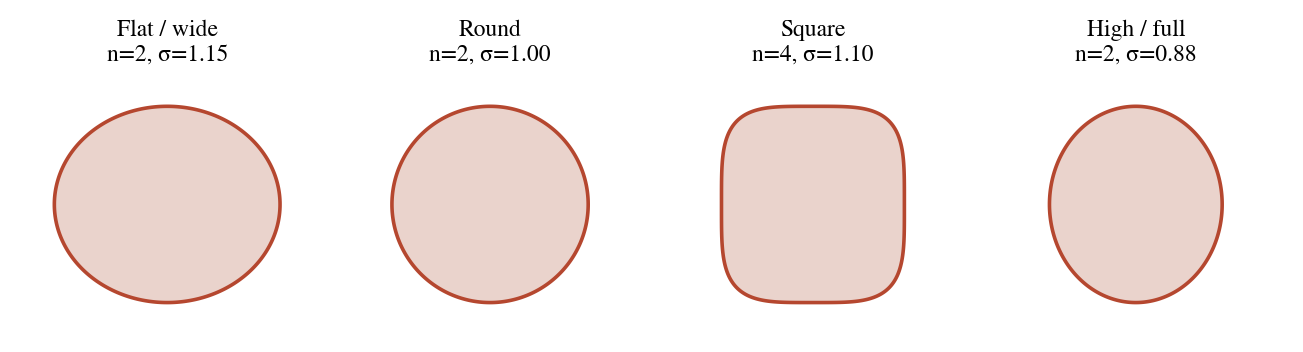
| Flat / wide | 1.15 | 5.36 | 23.7 | 8.9 | 6.90 | 0.38 |
| Round | 1.00 | 5.00 | 24.0 | 8.9 | 6.96 | 0.41 |
| Square | 1.10 | 5.24 | 24.0 | 8.9 | 6.92 | 0.39 |
| High / full | 0.88 | 4.69 | 24.5 | 9.0 | 6.97 | 0.42 |
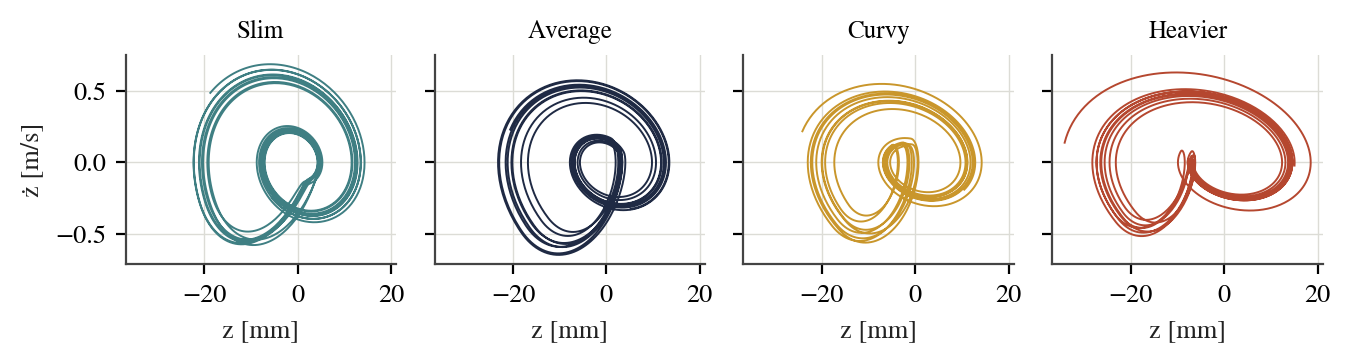
4 · Gait resonance
Amplitude depends on cadence as well as body. A running heel-strike train has energy at the step frequency and its harmonics; the jiggle peaks when a harmonic meets the tissue resonance. In the sweep the amplitude maxima fall at 2.87 steps/s (slim), 2.46 (average) and 2.17 (curvy), each close to fn/2, the second harmonic.
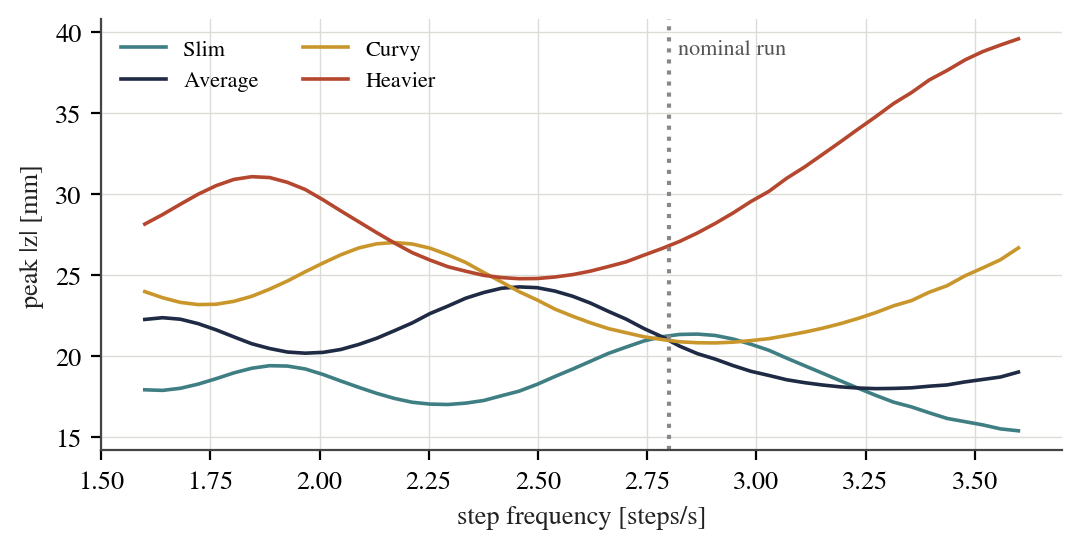
So “heavier means bigger jiggle” is a tendency, not a law: shifting cadence away from a resonance reduces the motion.
5 · Sensitivity to the assumptions
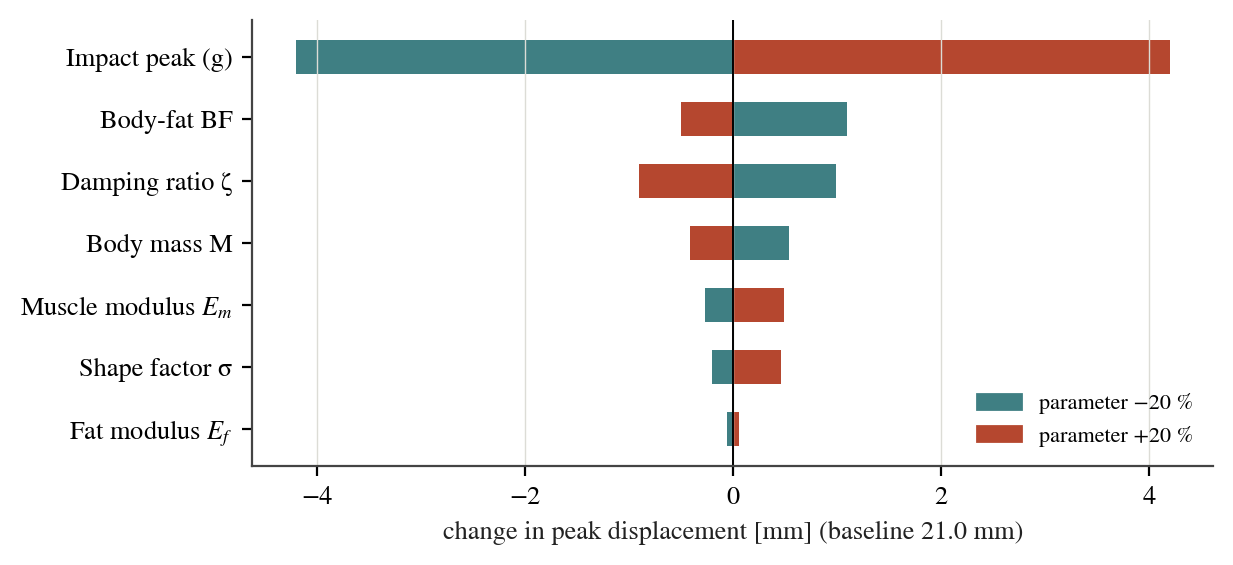
Each parameter was varied ±20 % around the average running case. Impact size dominates trivially (the model is linear); among tissue properties damping ratio and body fat matter most (≈ ±1 mm), then mass, muscle modulus and shape (≈ ±0.2–0.5 mm). Damping is therefore the first quantity worth measuring.
6 · A simulated population
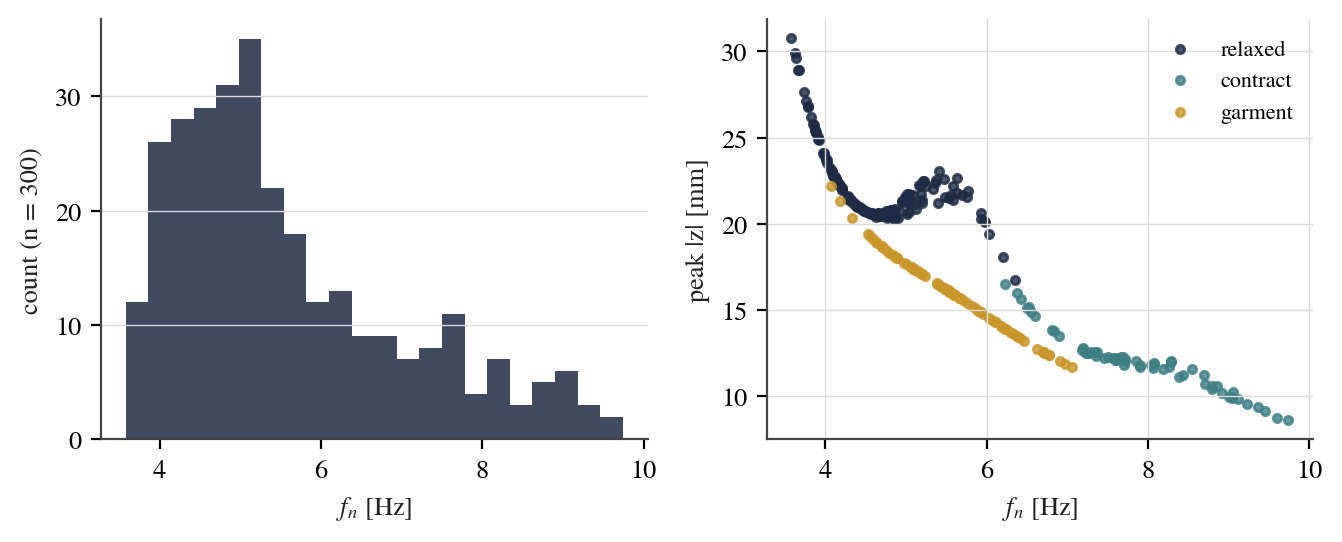
300 virtual bodies (50–110 kg, 15–45 % fat, varying shape, 25 % contracted and 25 % garment). Natural frequency averages 5.6 Hz (5–95 %: 3.9–8.7 Hz); peak displacement averages 18 mm (11–25 mm). Among relaxed bodies, peak ∝ fn−0.5 (correlation -0.68), while the correlation with body mass is only 0.46: frequency predicts amplitude better than mass does.
7 · Could it be measured?
Simulated test: fit the transfer function between pelvis and tissue acceleration from noisy 60 s records. The natural frequency is recovered to within about 2 % even at 5 dB SNR; damping is biased high by roughly 14–17 % (spectral resolution and leakage from the harmonic input), so it needs longer records or a time-domain fit to isolated decays.
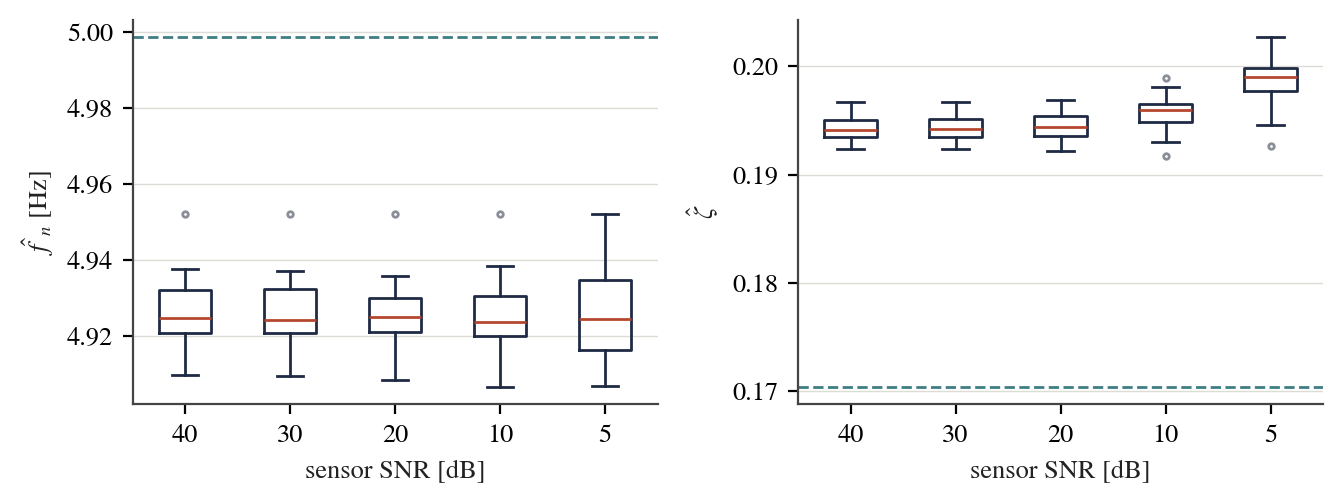
Protocol: two IMUs (≥ 200 Hz), one on the sacrum and one on the gluteal belly, treadmill walking and running, relaxed / contracted / garment, at least 10 participants per predictor, informed consent and ethics approval.
8 · Geometry of the shape factor
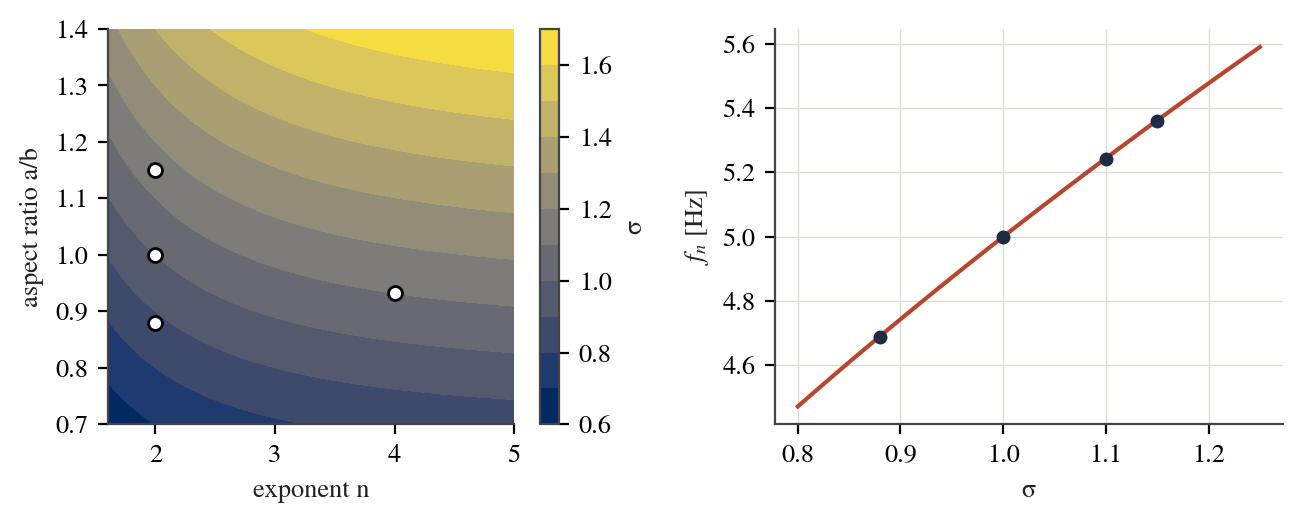
Tissue is drawn as a superellipse |x/a|ⁿ + |y/b|ⁿ = 1. The shape factor is σ = (a/b)·g(n)/g(2) with g(n) = Γ(1+1/n)² / Γ(1+2/n), so wide shallow tissue is stiffer and faster, tall deep tissue softer and slower. Since fn ∝ √σ, a 15 % change in σ moves fn by only about 7 %.
Limits
The model is one-dimensional and linear; moduli, damping ratios, C₀ and σ are assumed rather than measured; asymmetry and pelvic motion in other axes are ignored. Treat the numbers as trends. The next step is to measure real participants (with consent and ethics approval) and check whether real fn and ζ match.